Another feature of Munetrix is the ability to control the message that is displayed to citizens. If your charts and reports include anomalies that need an explanation, these explanations can be included in the footnote of charts and reports.
When adding narratives you must make three choices that affects where the narrative will appear;
1. Which charts – will the narrative appear on Expenditure or Revenue charts
2. Which Funds – will the narrative appear for all funds or for a specific fund
3. Which Years – will the narrative appear on reports that span multiple years or a specific year
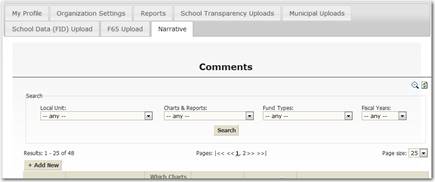
Local Unit – the Local Unit drop down will provide a list of the municipalities or school districts for which you have editing rights. If you have editing rights for more than one district it is suggested to first filter the list by local unit.
Charts & Reports – the Charts & Reports drop down provides a list of the types of output the narrative can be attached. For example, if you want a comment to appear at the bottom of Expenditure charts you would select Expenditures from this drop down.
Fund Types – the Fund Types drop down gives you the ability to make Fund-specific narratives. For example, if you want a narrative to only appear when a user filters for a specific fund than select that fund from the drop down. If you want a narrative to appear when the user selects All Funds you would choose All Funds from the drop down.
Fiscal Years – the Fiscal Years drop down gives you the ability to make Year-specific narratives. For example, if you want a narrative to only appear when a user report from a specific fiscal year then select that year from the drop down. If you want a narrative to appear when the user selects a report that spans multiple years then you would choose All Funds from the drop down.
Figure 98: The Narrative data screen for managing local unit-specific comments