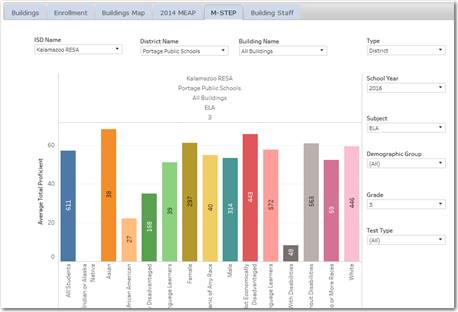
Academic Achievement data by building can be accessed in the Buildings Manager app. The analysis chart at the Building Level is a DataXplorer that permits access to M-Step data for any combination of ISD, District, Building, Grade, Subject, or Student Demographic Group in the state. By default, the chart opens for your district filtered for all buildings 3rd-grade ELA proficiency results.

Figure 42: example of M-Step achievement data at the building level
The colored columns identify each student demographic group, the height of the column is related to the Y-axis Total Proficiency level, and the numbers within the bars identify the number of students assessed.
The chart includes several cascading filters. These filters are very powerful but require a little experimenting to understand their dynamics. Each filter is dependent on the item selected in the others. For example, if a specific district(s) is selected in the District Name filter then only that district’s ISD(s) will appear in the ISD Name filter.